
 Facebook
 Twitter
 Pinterest
 Copy Link

Q3 2018 Matthew Gardner Report

The following analysis of the Western Washington real estate market is provided by Windermere Real Estate Chief Economist Matthew Gardner. We hope that this information may assist you with making better-informed real estate decisions.
ECONOMIC OVERVIEW
Washington State continues to be one of the fastest growing states in the nation and there is little to suggest that there will be any marked slowdown in the foreseeable future. Over the past year, the state has added 105,900 new jobs, representing an annual growth rate of 3.2%. This remains well above the national rate of 1.65%. Private sector employment gains continue to be robust, increasing at an annual rate of 3.7%. The strongest growth sectors were Construction (+7.4%), Information (+6.2%), and Professional & Business Services (+6.1%). The state’s unemployment rate was 4.5%, down from 4.8% a year ago.
All year I’ve been predicting that Washington State’s annual job growth would outperform the nation as a whole, and we now know with certainty that this is going to be the case. Furthermore, I am now able to predict that statewide job growth in 2019 will be equally strong, with an expected increase of 2.6%.
HOME SALES ACTIVITY
- There were 22,310 home sales during the third quarter of 2018. This is a significant drop of 12.7% compared to the third quarter of 2017.
- The number of homes for sale last quarter was up 14.5% compared to the third quarter of 2017, continuing a trend that started earlier in the year. However, the increase in listings was only in Seattle’s tri-county area (King, Pierce, and Snohomish Counties) while listing activity was down across the balance of the region.
- Only two counties had a year-over-year increase in home sales, while the rest of Western Washington saw sales decrease.
- The region has reached an inflection point. With the increase in the number of homes for sale, buyers now have more choices and time to make a decision about what home to buy.


HOME PRICES
- As inventory levels start to rise, some of the heat has been taken off the market, which caused home prices in the Western Washington region to go up by a relatively modest 6.2% over last year to $503,039. Notably, prices are down by 4.4% when compared to the second quarter of this year.
- Home prices, although higher than a year ago, continue to slow due to the significant increase in the number of homes for sale. This, in my opinion, is a very good thing.
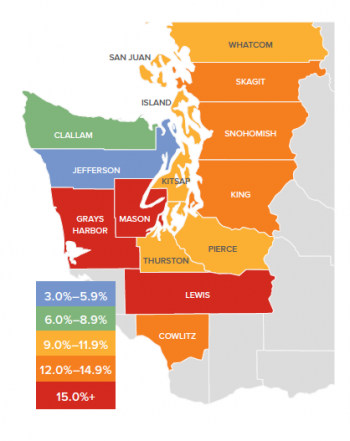
- When compared to the same period a year ago, price growth was strongest in Lewis County, where home prices were up 15.3%. Six other counties experienced double-digit price increases.
- Slowing price growth was inevitable; we simply could not sustain the increases we’ve experienced in recent years. Lower rates of appreciation will continue until wage growth catches up.

DAYS ON MARKET
- The average number of days it took to sell a home dropped by four days compared to the same quarter of 2017.
- Across the entire region, it took an average of 39 days to sell a home in the third quarter of this year. This is down from 43 days in the third quarter of 2017 and down 2 days when compared to the second quarter of 2018.
- King County continues to be the tightest market in Western Washington, with homes taking an average of only 19 days to sell. Every county in the region other than Skagit and King — which both saw the time on the market rise by 2 days — saw the length of time it took to sell a home drop when compared to the same period a year ago.
- More choice in the market would normally suggest that the length of time it takes to sell a home should rise, but the data has yet to show that. That said, compared to last quarter, we are seeing some marked increases in days on market in several counties, which will be reflected in future reports.

CONCLUSIONS

This speedometer reflects the state of the region’s real estate market using housing inventory, price gains, home sales, interest rates, and larger economic factors. For the second quarter of 2018, I have moved the needle very slightly towards buyers, but it remains firmly a seller’s market. This shift is a function of price growth tapering very slightly, as well as the expectation that we should see more homes come on the market as we move through the balance of the year.

Mr. Gardner is the Chief Economist for Windermere Real Estate, specializing in residential market analysis, commercial/industrial market analysis, financial analysis, and land use and regional economics. He is the former Principal of Gardner Economics and has more than 30 years of professional experience both in the U.S. and U.K.
Q2 2018 Matthew Gardner Report

The following analysis of the Western Washington real estate market is provided by Windermere Real Estate Chief Economist Matthew Gardner. We hope that this information may assist you with making better-informed real estate decisions.
Economic Overview
The Washington State economy added 83,900 new jobs over the past 12 months, representing an annual growth rate of 2.5%. This is a slowdown from the last quarter, but employment growth remains well above the national rate of 1.6%. Employment gains continue to be robust in the private sector, which was up by 2.8%. The public sector (government) grew by a more modest 1.1%.
The strongest growth sectors were Retail Trade and Construction, which both rose by 4.8%. Significant growth was also seen in the Education & Health Services and Information sectors, which rose by 3.9% and 3.4%, respectively.
The State’s unemployment rate was 4.7%, down from 4.8% a year ago. Washington State will continue adding jobs for the balance of the year and I anticipate total job growth for 2018 will be around 80,000, representing a total employment growth rate of 2.4%.
Home Sales Activity
-
There were 23,209 home sales during the second quarter of 2018. This is a drop of 2.3% compared to the same period a year ago.
-
Clallam County saw sales rise the fastest relative to the same period a year ago, with an increase of 12.6%. Jefferson County also saw significant gains in sales at 11.1%.
-
The number of homes for sale last quarter was down by a nominal 0.3% when compared to the second quarter of 2017, but up by 66% when compared to the first quarter of this year. Much has been mentioned regarding the growth in listings, but it was not region-wide. King County saw a massive 31.7% increase in inventory, though all but three of the other counties covered in this report saw the number of listings drop compared to a year ago.
-
The takeaway from this data is that while some counties are seeing growth in listings — which will translate into sales down the road — the market is still out of balance.

Home Prices
-
 As inventory is still fairly scarce, growth in home prices continues to trend well above the long-term average. Prices in Western Washington rose 12.2% over last year to $526,398.
 -
Home prices continue to trend higher across Western Washington, but the pace of growth has started to slow. This should please would-be buyers. The spring market came late but inventory growth in the expensive King County market will give buyers more choices and likely lead to a slowing down of price growth as bidding wars continue to taper.
-
When compared to the same period a year ago, price growth was strongest in Mason County, which was up 17.4%. Eleven other counties experienced double-digit price growth.
-
Mortgage rates, which had been rising significantly since the start of the year, have levelled off over the past month. I believe rising rates are likely the reason that inventory levels are rising, as would-be sellers believe that this could be the right time to cash out. That said, the slowing in rate increases has led buyers to believe that rates will not jump soon, which gives them a little more breathing room. I do not expect to see any possible slowdown in demand until mortgage rates breach the 5% mark.
Days on Market
-
The average number of days it took to sell a home dropped by seven days compared to the same quarter of 2017.
-
King County continues to be the tightest market in Western Washington, with homes taking an average of only 13 days to sell. Every county in the region other than Clallam saw the length of time it took to sell a home drop when compared to the same period a year ago.
-
Across the entire region, it took an average of 41 days to sell a home in the second quarter of this year. This is down from 48 days in the second quarter of 2017 and down by 20 days when compared to the first quarter of 2018.
-
Although we did see some inventory increases when compared to the first quarter of the year, we are essentially at the same level of homes on the market as a year ago. The market has yet to reach equilibrium and I certainly do not expect to reach that point until sometime in 2019.

Conclusions

This speedometer reflects the state of the region’s real estate market using housing inventory, price gains, home sales, interest rates, and larger economic factors. For the second quarter of 2018, I have moved the needle very slightly towards buyers, but it remains firmly a seller’s market. This shift is a function of price growth tapering very slightly, as well as the expectation that we should see more homes come on the market as we move through the balance of the year.

Matthew Gardner is the Chief Economist for Windermere Real Estate, specializing in residential market analysis, commercial/industrial market analysis, financial analysis, and land use and regional economics. He is the former Principal of Gardner Economics, and has more than 30 years of professional experience both in the U.S. and U.K.
This post originally appeared on the Windermere.com Blog.
Q1 2018 Matthew Gardner Report


The following analysis of the Western Washington real estate market is provided by Windermere Real Estate Chief Economist Matthew Gardner. We hope that this information may assist you with making better-informed real estate decisions.
Economic Overview
The Washington State economy added 96,900 new jobs over the past 12 months, representing an annual growth rate of 2.9%—still solidly above the national rate of 1.5%. Most of the employment gains were in the private sector, which rose by 3.4%. The public sector saw a more modest increase of 1.6%.
The strongest growth was in the Education & Health Services and Retail sectors, which added 17,300 and 16,700 jobs, respectively. The Construction sector added 10,900 new positions over the past 12 months.
Even with solid increases in jobs, the state unemployment rate held steady at 4.7%—a figure that has not moved since September of last year.
I expect the Washington State economy to continue adding jobs in 2018, but not at the same rate as last year given that we are nearing full employment. That said, we will still outperform the nation as a whole when it comes to job creation.
Home Sales Activity
- There were 14,961 home sales during the first quarter of 2018. This is a drop of 5.4% over the same period in 2017.
- Clallam County saw sales rise the fastest relative to the first quarter of 2017, with an increase of 16.5%. In most of the other markets, the lack of available homes for sale slowed the number of closings during this period.
- Listing inventory in the quarter was down by 17.6% when compared to the first quarter of 2017, but pending home sales rose by 2.6% over the same period, suggesting that closings in the second quarter should be fairly robust.
- The takeaway from this data is that the lack of supply continues to put a damper on sales. I also believe that the rise in interest rates in the final quarter of 2017 likely pulled sales forward, leading to a drop in sales in the first quarter of 2018.

Home Prices
 With ongoing limited inventory, it’s not surprising that the growth in home prices continues to trend well above the long-term average. Year-over-year, average prices rose 14.4% to $468,312.
- Economic vitality in the region is leading to robust housing demand that far exceeds supply. Given the relative lack of new construction homes— something that is unlikely to change any time soon—there will continue to be pressure on the resale market. As a result, home prices will continue to rise at above-average rates in the coming year.
- When compared to the same period a year ago, price growth was strongest in Grays Harbor County at 27.5%. Ten additional counties experienced double-digit price growth.
- Mortgage rates continued to rise during first quarter, and are expected to increase modestly in the coming months. By the end of the year, interest rates will likely land around 4.9%, which should take some of the steam out of price growth. This is actually a good thing and should help address the challenges we face with housing affordability—especially in markets near the major job centers.

Days on Market
- The average number of days it took to sell a home dropped by seven days when compared to the same quarter of 2017.
- King County continues to be the tightest market in Western Washington, with homes taking an average of 24 days to sell. Every county in the region saw the length of time it took to sell a home either drop or remain essentially static relative to the same period a year ago.
- In looking at the entire region, it took an average of 61 days to sell a home in the first quarter of this year. This is down from 68 days in the first quarter of 2017 but up by eleven days when compared to the fourth quarter of 2017.
- Anyone expecting to see a rapid rise in the number of homes for sale in 2018 will likely be disappointed. New construction permit activity—a leading indicator—remains well below historic levels and this will continue to put increasing pressure on the resale home market.

Conclusions
 This speedometer reflects the state of the region’s housing market using housing inventory, price gains, home sales, interest rates, and larger economic factors. For the first quarter of 2018, I have left the needle at the same point as fourth quarter of last year. Price growth remains strong even as sales activity slowed. All things being equal, 2018 is setting itself up to be another very good year for sellers but, unfortunately, not for buyers who will still see stiff competition for the limited number of available homes for sale.
Matthew Gardner is the Chief Economist for Windermere Real Estate, specializing in residential market analysis, commercial/industrial market analysis, financial analysis, and land use and regional economics. He is the former Principal of Gardner Economics, and has more than 30 years of professional experience both in the U.S. and U.K.
This article originally appeared on the Windermere.com blog.
Our Team
Skeets Fletcher and his team have enjoyed success, for decades, in the business of locating and selling unfinished and finished lots to developers and homebuilders whether they build 10, 100 or 900 homes each year. By focusing on the needs of each developer or builder he has worked with over the years in whatever sub-market in the Puget Sound region they want to be in he has been able to find thousands of lots and help them grow their business to whatever level they choose. Time has proven we know what we’re doing and how to help you accomplish your objectives. Contact us to learn more or talk about how we can work together.
The Top 10 Projects so Far
These are 10 of the Top Projects I’ve worked on so far for a variety of reasons:
1. 1997 – Riverwalk in Spokane: This is the first land transaction I ever did. I realized that this 144 lot deal in Spokane opened up a whole new arena in Real Estate for me. Riverwalk was fully entitled or “permit ready” so the Buyer closed the purchase and developed the lots.
2. 1998 – Llama Landing / in Sammamish: This is the first transaction I did with Steve Burnstead Construction. It was 138 unfinished lots and the first of several land transactions I did with Steve between 1998 and 2006. The others were Woodside in McGarvey Park in Fairwood ( 60 lots ), Island Lane on Mercer Island (15 finished lots) between the South QFC and the Athletic Club. I thought the guy that called me about them was kidding but he was serious they were about to be finished. We did that deal with a 2 day feasibility and closed a month later. McGarvey Park was developed by Pt Blakely Communities and led to Issaquah Highlands (198 finished lots) where Steve bought lots in different divisions. Limelight Hotel in Sun Valley. Steve had told me to keep an eye out for something in Sun Valley, Idaho where I had lived for a couple years in the 70’s and then vacationed in the summer and winter for many years up until that time 2004. When a friend of mine in Sun Valley told me he and his family were thinking about selling an entire city block that had an unblockable view of Mt Baldy I knew this was a “one of a kind” opportunity. I knew this was something Steve would like, we talked in November of 2004 about it, he bought it, got the property entitled for a hotel with a layer of penthouses on top all looking up at the mountain Mt Baldy. It has been purchased by the group Auberge Resorts and is projected to be completed by sometime in 2018. Good relationships work for everyone.
3. 2004/2005 – Limelight Hotel in Sun Valley: I allready described this project above that Steve Burnstead Construction bought but it was such a “one of a kind” deal that it goes on my Top 10 List.

Limelight Hotel in Ketchum, Idaho. Just opened in February 2017.
4. 2004 – 2007 – Quadrant w/1,300 lot deal: This was a bulk deal I did with Quadrant to help them grow and meet the objectives in their business plan. Projects included Donegal Park (144 finished lots) and Donegal Lane (58 finished lots) in Lynnwood, Trovitsky Park (169 finshed lots) in Fairwood/Renton, Kentlake Highlands (307 finished lots) in Maple Valley, the Outlook (275 finished lots) north of Mill Creek. Good relationships work well for everyone.
5. 2005 – Manor Way in Lynnwood: Manor Way (80 finished lots) was a project I got a call about from an appraiser friend of mine w/a tip about a deal going down that he thought was not going to make it. I knew Legacy Homes was almost sold out of a nearby neighborhood which had done very well. I called the owner of Legacy and confirmed he’d want this new neighborhood of finished lots. I knew the Sellers and confirmed that their current deal was not a deal yet and was floundering, I confirmed what the deal points would have to met to secure the project and did it. Good relationships work for everyone.
6. 2000 – 2016 / DR Horton: This is the longest term relationship I’ve had in the 20 years I’ve been selling land vs houses, of a 38 year career. DR Horton’s first deal with me was Miller’s Homestead (68 finished lots) in Duvall, then, over time, Woodside in McGarvey Park (200 finished lots), Issaquah Highlands (200+ finished lots), Landcastle Estates (68 finished lots) in Puyallup, Puyallup Highlands ( 34 finished lots) in Puyallup), and others that are currently pending. Good relationships work for everyone.
7. 2007 – 2008 / The Bridges in Kent: I’d like to have been able to say I sold this since The Bridges (486 lots to be finished) was such a huge chunk of business but the Great Recession caught up to us just as the developer had the first phases ready to go. After a really cool “Wine bottles” promotion where I had wine bottles relabeled to represent the 4 types of lots we were bringing to market. We targeted the top 25 homebuilders, labeled the wine bottles, had them delivered strategically over 4 days and then followed up for meetings to determine level of interest. It was a blast! We even had a homebuilder gettting into his car with a $400,000 Earnest Money check ready to waive feasibility on Phase 1 and his gut told him to get out of the car and don’t do it. What also was really memorable for me was the promotion we did to launch this project (see pictures).
8. Talbot Place in Kirkland: (11 Unfinished lots permit ready) This was the one that proved that the recession was over. I sold an 11 unit townhouse project to the Developer/Builder and Carrie Lord (my fiance’) and I sold the homes. Good old Kirkland!
9. 2008 – 2010 / Honeybrooke West: I got a listing on 50 lots in the Renton Highlands called Honeybrooke West (50 finished lots) that were essentially finished. We went to market with it, got 6 offers (in the summer of 2008 you may remember the market was clearly depressed) sold it to a little start-up company from Puyallup called SDC Homes (that later sold out to Richmond American) that could build smaller, less amenitized homes (the furnace was an upgrade) and for half of the price that the Renton Highlands sub-market was still trying to get for homes. We loaded them onto the NWMLS on a wednesday, went on site thursday – sunday and sold 22 of them. During the next 17 days or a total of 21 days we sold 46 of 50, closed the acquisition of the lots with the King County Superior Courts approval and started the first 25 within app. 45 days with funding from a local bank before the Feds shut them down. We switched to private capital, bought a nearby plat from Camwest Homes Alderwood Crossing (60 finished lots) and a 7 lot neighborhood from the same lender that financed Honeybrooks’s development, acquired a 46 lot plat called Tahoma Vista II (46 finished lots) in Kent and proceeded to sell them all out in about 16 months. It was so amazing to have that level of success during the recession but it proved to everyone what price could do. This ended up accounting for app. $64m in total land and house sales during the most depressing and long lasting downturn anybody had ever experienced. 50 finished lots from the King County Superior Court to a start-up homebuilder, pre-sales of homes with an average sales price of $300k for 2,000 square foot houses in a sub-market that averaged $600k for 3,000 square foot houses and a bunch of really motivated buyers who recognized a great value no matter what the economy was doing and you have a really good success story for a team of professionals who really dug in and worked together.
10. 2013 – 2016 / Finished and Unfinished lots in Pierce County: We sold this 600 unit multi-family parcel to a California developer, he re-entitled it into 206 lot single family lots and we sold it to a local developer who is finishing the lots. We then sold the finished lots to a local “Top 10” builder. By the time the finished lots were sold this project accounted for app. $23m.
What I call the Top 10 or most interesting projects I’ve worked on accounts for the sale of app. 3,900 finished or unfinished lots of app. 6,500 lots I’ve sold so far.
Comments: Whether its a 1-2 lot deal for smaller short plats to $20 – 30,000,000 deals to large builders I’ve enjoyed each and every one of them. It didn’t have to be a large deal like Rainier Vista ( 144 finished lots for $175,000 or $25.2m, a series of deals in Woodside in McGarvey Park (260 finished lots for app. $20.2m, Seattle Hill (275 finished lots at $39m to be fun and profitable but the big ones are always complicated and require professional developers and builders to work together.


