Homeowner August 8, 2019

Extend the Life of your Roof

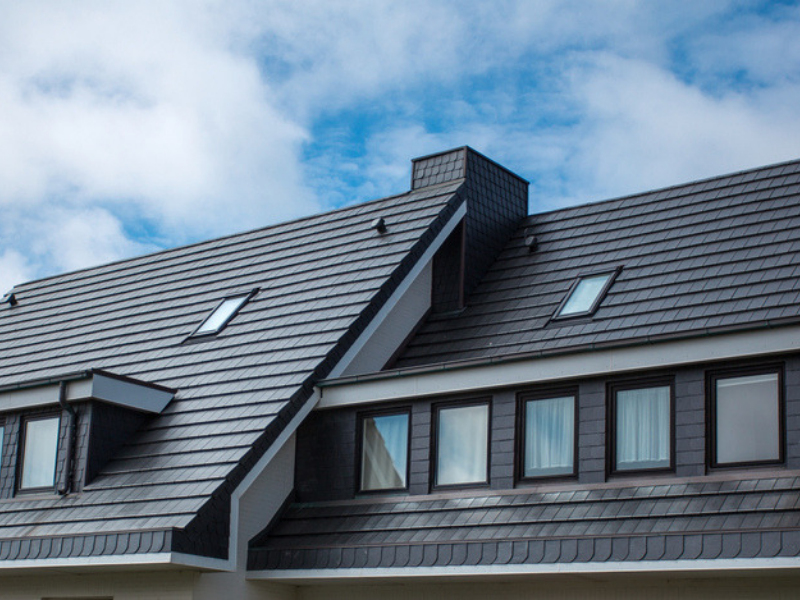
Your roof is one of the most important and expensive assets of your home, but no other element is quite as valuable. While the average lifespan of a roof is about 15 years, careful homeowners can extend the life of their homes without enduring too many hardships. Take a look at these three quick maintenance tips to help your roof last.

Keep Your Gutters Clear

Debris that accumulates and clogs your gutters adds extra weight and pulls at your roof’s fascia, which can be a costly fix. Look down the length of your roof for any signs of sagging or bending – that’s a sure sign your gutters are carrying too much weight and pulling at your roof.

Don’t forget the downspouts either, and don’t be fooled by easy-flowing water. Moss and algae buildup on and around your roof can slowly eat away at your roofing material and severely compromise its integrity.


Focus On The Attic

The exterior of your roof isn’t the only area you should focus on as your attic is your roof’s first line of defense against damage with a two-pronged approach: insulation and ventilation.

Insulating your attic has the double benefit of keeping your home’s internal temperature consistent while also preventing vapor and moisture buildup on the underside of your roof. When combined with proper ventilation your attic can stay dry and keep your roof’s rafters safe from moisture damage.

A great way to keep properly ventilate is to add a fan or dehumidifier to the attic.

Catch Problems Early

Check on your roof regularly, an easy time to remember to check is with every change of the season, or after a significant storm. Catching small issues early on will save you money in the long run, so utilizing the services of a reliable, professional roofer is an invaluable asset. As with any working professional, it’s a good idea to establish a working relationship with a roofer and even consider scheduling a yearly checkup for your roof just to make sure there aren’t any problems sneaking up on you. After all, spending a little each year to maintain your roof is a lot better than dropping $15,000-$50,000 on a new one, right?

Gardner ReportMarket News July 25, 2019

Q2 Western Washington Real Estate Market Update

The following analysis of the Western Washington real estate market is provided by Windermere Real Estate Chief Economist Matthew Gardner. We hope that this information may assist you with making better-informed real estate decisions. For further information about the housing market in your area, please contact me!


ECONOMIC OVERVIEW

Washington State employment jumped back up to an annual growth rate of 2.4% following a disappointing slowdown earlier in the spring. As stated in the first quarter Gardner Report, the dismal numbers earlier this year were a function of the state re-benchmarking its data (which they do annually).

The state unemployment rate was 4.7%, marginally up from 4.5% a year ago. My current economic forecast suggests that statewide job growth in 2019 will rise by 2.6%, with a total of 87,500 new jobs created.


HOME SALES

  • There were 22,281 home sales during the second quarter of 2019, representing a drop of 4.8% from the same period in 2018. On a more positive note, sales jumped 67.6% compared to the first quarter of this year.
  • Since the middle of last year, there has been a rapid rise in the number of homes for sale, which is likely the reason sales have slowed. More choice means buyers can be more selective and take their time when choosing a home to buy.
  • Compared to the second quarter of 2018, there were fewer sales in all counties except Whatcom and Lewis. The greatest declines were in Clallam, San Juan, and Jefferson counties.
  • Listings rose 19% compared to the second quarter of 2018, but there are still a number of very tight markets where inventory levels are lower than a year ago. Generally, these are the smaller — and more affordable — markets, which suggests that affordability remains an issue.


HOME PRICES

  • Year-over-year price growth in Western Washington continues to taper. The average home price during second quarter was $540,781, which is 2.8% higher than a year ago. When compared to first quarter of this year, prices were up 12%.
  • Home prices were higher in every county except King, which is unsurprising given the cost of homes in that area. Even though King County is home to the majority of jobs in the region, housing is out of reach for many and I anticipate that this will continue to act as a drag on price growth.
  • When compared to the same period a year ago, price growth was strongest in Lewis County, where home prices were up 15.9%. Double-digit price increases were also seen in Mason, Cowlitz, Grays Harbor, and Skagit counties.
  • The region’s economy remains robust, which should be a positive influence on price growth. That said, affordability issues are pervasive and will act as a headwind through the balance of the year, especially in those markets that are close to job centers. This will likely force some buyers to look further afield when searching for a new home.


DAYS ON MARKET

  • The average number of days it took to sell a home matched the second quarter of 2018.
  • Snohomish County was the tightest market in Western Washington, with homes taking an average of only 21 days to sell. There were five counties where the length of time it took to sell a home dropped compared to the same period a year ago. Market time rose in eight counties and two were unchanged.
  • Across the entire region, it took an average of 41 days to sell a home in the second quarter of 2019. This was the same as a year ago but is down 20 days compared to the first quarter of 2019.
  • As stated above, days-on-market dropped as we moved through the spring, but all markets are not equal. I suggest that this is not too much of an issue and that well-priced homes will continue to attract attention and sell fairly rapidly.

CONCLUSIONS

This speedometer reflects the state of the region’s real estate market using housing inventory, price gains, home sales, interest rates, and larger economic factors. I am leaving the needle in the same position as the first quarter as demand appears to still be strong.

The market has benefitted from a fairly significant drop in mortgage rates. With average 30-year fixed rates still below 4%, I expect buyers who have been sitting on the fence will become more active, especially given that they have more homes to choose from.


As Chief Economist for Windermere Real Estate, Matthew Gardner is responsible for analyzing and interpreting economic data and its impact on the real estate market on both a local and national level. Matthew has over 30 years of professional experience both in the U.S. and U.K.

In addition to his day-to-day responsibilities, Matthew sits on the Washington State Governors Council of Economic Advisors; chairs the Board of Trustees at the Washington Center for Real Estate Research at the University of Washington; and is an Advisory Board Member at the Runstad Center for Real Estate Studies at the University of Washington where he also lectures in real estate economics.

Market News July 13, 2019

Local Market Update – July 2019

The market in our region appears to be moderating. Inventory is up, prices are relatively stable and homes are taking a bit longer to sell. However, with less than two months of available inventory, supply is still far short of demand. Steady buyer activity, low interest rates and a thriving economy are making for a strong summer in the housing market.

Eastside

>>>Click image to view full report.

The median price of a single-family home on the Eastside was $950,000 in June, down 3% from the same time last year and up $21,000 from May. Many buyers are looking to take advantage of the Eastside jobs boom with Amazon announcing plans to build a 43-story tower in Bellevue and Google expecting to reach 1 million square feet of office space in Kirkland.

King County

>>>Click image to view full report.

There was good news for buyers in June as a growing supply of homes helped boost inventory close to 2012 listing levels. The median price of a single-family home in King County was $695,000. That figure is a 3% drop from a year ago and virtually unchanged from May. 33% of homes sold above list price; another sign prices are moderating when compared to 52% of homes sold over list price this time last year.

Seattle

>>>Click image to view full report.

Home inventory in Seattle inched slightly higher in June. However, with less than two months of supply, the city is still a solid seller’s market. Apple’s plan to turn Seattle into a key engineering hub can only add to demand. The median price of a single-family home in Seattle was $781,000, down 4% from a year ago and nearly unchanged from May.

Snohomish County

>>>Click image to view full report.

After hovering around $500,000 since March, home prices in Snohomish County crept up in June. The median price of a single-family home was $515,500, as compared to $511,500 last June. Snohomish County continues to attract buyers priced out of the King County market, putting an additional strain on supply which stands a just 1.5 months of inventory.

Living July 11, 2019

What to Consider Before You Build

If you’re short on space but don’t want to move, a home addition is an attractive way to solve your woes and turn your current home into your dream home.

Whether you’re adding a whole new room or a more modest addition, it can turn into a major construction project; with architects and contractors to manage, construction workers traipsing through your home, hammers pounding, and sawdust everywhere. Although new additions can be a great investment, the cost per-square-foot is typically more than building a new home, and much more than buying a larger existing home.

Before you make the leap, consider the following:

Define your needs

To determine if an addition makes sense for your situation, start by defining exactly what it is you want and need. By focusing on core needs, you won’t get carried away with a wish list that can push the project out of reach financially.

If it’s a matter of needing more space, be specific. For example, instead of just jotting down “more kitchen space,” figure out just how much more space is going to make the difference, e.g., “150 square feet of floor space and six additional feet of counter space.”

If the addition will be for aging parents, consult with their doctors or an age-in-place expert to define exactly what they’ll require for living conditions, both now and over the next five to ten years.


Types of Additions

Bump-out Addition

“Bumping out” one or more walls to make a first-floor room slightly larger is something most homeowners think about at one time or another. However, when you consider the work required, and the limited amount of space created, it often ends up to be one of your more expensive approaches.

First Floor Addition

Adding a whole new room (or rooms) to the first floor of your home is one of the most common ways to add space to a home. You can easily create a new family room, apartment or sunroom. But this approach can also take away yard space.

Dormer Addition

For homes with steep rooflines, adding an upper floor dormer may be all that’s needed to transform an awkward space with limited headroom. The cost is affordable and, when done well, a dormer can also improve the curb-appeal of your house.

Second-Story Addition

For homes without an upper floor, adding a second story can double the size of the house without reducing surrounding yard space. But be cautious not to ruin the value of homes next to you when you do this, the second story might not be worth the drama on your block.

Garage Addition

Building above the garage is ideal for a space that requires more privacy, such as a rentable apartment, a teen’s bedroom, guest bedroom, guest quarters, or a family bonus room.


Permits required

You’ll need a building permit to construct an addition—which will require professional blueprints. Your local building department will not only want to make sure that the addition adheres to the latest building codes, but also ensure it isn’t too tall for the neighborhood or positioned too close to the property line. Some building departments will also want to ask your neighbors for their input before giving you the go-ahead.


Requirements for a legal apartment

While the idea of having a renter that provides an additional stream of revenue may be enticing, the realities of building and renting a legal add-on apartment can be sobering. Among the things you’ll need to consider:

  • Special permitting—Some communities don’t like the idea of “mother-in-law” units and therefore have regulations against it, or zone-approval requirements.
  • Separate utilities—In many cities, you can’t charge a tenant for heat, electricity, and water unless utilities are separated from the rest of the house (and separately controlled by the tenant).
  • ADU Requirements—When building an “accessory dwelling unit” (the formal name for a second dwelling located on a property where a primary residence already exists), building codes often contain special requirements regarding emergency exists, windows, ceiling height, off-street parking spaces, the location of main entrances, the number of bedrooms, and more.

In addition, renters have special rights while landlords have added responsibilities. You’ll need to learn those rights and responsibilities and be prepared to adhere to them. Be sure to talk to with me about municipal, state, and federal laws.


Average costs

The cost to construct an addition depends on a wide variety of factors, such as the quality of materials used, the laborers doing the work, the type of addition and its size, the age of your house and its current condition. For ballpark purposes, however, you can figure on spending about $200 per square foot if your home is in a more expensive real estate area, or about $100 per food in a lower-priced market.

You might be wondering how much of that money might the project return if you were to sell the home a couple years later? The answer to that question depends on the above details; but the average “recoup” rate for a family-room addition is typically more than 80 percent.


The Bottom Line

While you should certainly research the existing-home marketplace before hiring an architect to map out the plans, building an addition onto your current home can be a great way to expand your living quarters, customize your home, and remain in the same neighborhood.

Market News June 27, 2019

Regional Market Update June 2019

The pace of the housing market gained momentum in May, bringing an uptick in open house traffic and offers. A drop in interest rates and increased inventory were great incentives for buyers. Despite the increase in supply there is less than two months of inventory available – half the national average and far short of what is considered balanced. Industry experts are predicting a strong market as we segue into summer.

Eastside

>>>Click image to view full report.

The median price of a single-family home on the Eastside was $928,800 in May, down 3% from the same time last year and virtually unchanged from April. With a booming economy that continues to grow, news of Amazon’s expansion in Bellevue, the latest Microsoft acquisition and plans for a $1.2 billion office park in Redmond, demand for housing on the Eastside is unlikely to decrease any time soon.

King County

>>>Click image to view full report.

Home sale activity in King County was brisk in May. According to a Windermere analysis, 7 out of 10 properties sold last month had 15 or fewer days on the market. More than half of the homes sold at or above list price. The median price of a single-family home was $700,000. While down 4% from the same time last year, that price was up about $22,000 from the previous month. Home to the fastest growing economy in the country,  King County is expected to draw even more buyers to the area this year.

Seattle

>>>Click image to view full report.

Seattle employment continues to grow faster than in most of the country.  This has made the city a top location for workers, particularly millennials.  Demand has put a strain on available homes, reducing the supply to just seven weeks of inventory available. May home prices in Seattle were lower than they were a year ago, but showed a healthy increase from the previous month. The median price of a single-family home was $784,925 in May, down 5% from a year ago and up $30,000 from April.

Snohomish County

>>>Click image to view full report.

In May, the median price of a single-family home in Snohomish County was $499,950. That number remains unchanged from a year ago, and also unchanged from March and April. Despite a 44% increase in inventory, the supply of homes for sale in this area is even tighter than in King County.  Brokers report that buyers are being drawn from King County and willing to trade a longer work commute for more affordable housing.

Gardner ReportMarket News June 27, 2019

Mortgage Rate Forecast

Geopolitical uncertainty is causing mortgage rates to drop. Windermere Chief Economist, Matthew Gardner, explains why this is and what you can expect to see mortgage rates do in the coming year.

Over the past few months we’ve seen a fairly significant drop in mortgage rates that has been essentially driven by geopolitical uncertainty – mainly caused by the trade war with China and ongoing discussions over tariffs with Mexico.

Now, mortgage rates are based on yields on 10-Year treasuries, and the interest rate on bonds tends to drop during times of economic uncertainty.  When this occurs, mortgage rates also drop.

My current forecast model predicts that average 30-year mortgage rates will end 2019 at around 4.4%, and by the end of 2020 I expect to see the average 30-year rate just modestly higher at 4.6%.

SOURCE: Windermere Blog

Windermere Community June 7, 2019

Windermere Celebrates 35 Years of Community Service!


If you try to call or stop by a Windermere office today you’ll notice that we’re closed for business. That’s because the entire Windermere network of agents, franchise owners, and staff are volunteering for our annual Community Service Day. For the past 35 years, our agents have taken one-day-a-year off to dig into hands-on community service projects, volunteering more than one million hours of time in the process.


So, what do we do on Community Service Day? This year, we can be found doing a variety of projects, such as weeding community gardens, cleaning and landscaping at various parks, sorting donations and cleaning up warehouse spaces at local nonprofits, cleaning animal shelters, building and auctioning off Adirondack chairs to benefit school district programs for homeless students, cleaning elementary schools, sorting/distributing food at food banks, preparing land for the growing season at food pantries, and helping to build a playground at a homeless shelter for families. This is just a sample of the projects that our offices have selected to complete on Windermere’s annual day of giving.


Community Service Day is something our company looks forward to every year because it gives us the opportunity to come together as a team to make a positive difference in the communities where we live, work, and play.

SOURCE: Windermere Blog

Market News May 26, 2019

The Housing Market in 2019

The last time we saw a balanced market was late 1990s, meaning many sellers and buyers have never seen a normal housing market.  Windermere Real Estate’s Chief Economist Matthew Gardner looks at more longer-term averages, what does he see for the future of the housing market?


Gardner ReportMarket News April 27, 2019

Q1 2019 Matthew Gardner Report

content_19015_WWAGardnerReportQ4_Masthead.png

The spring home buying season started early this year. Open houses had increased attendance and bidding wars returned in March. Home prices in most of the region are about even with March of 2018. The Eastside median closed sales price decreased 1% from March 2018 ($831,000) to March 2019 ($825,000).

Months supply of inventory decreased from 1.8 in February 2019 to 1.2 in March 2019, its lowest in nine months. The number of Eastside sales increased 2% for the first quarter 2019 compared to 2018. The speed of the market (percentage of homes sold in two weeks or less, number of multiple offers) is slower than a year ago (arguably a good thing), although it is speeding up.

Screen Shot 2019-05-14 at 6.52.55 PM.png
Screen Shot 2019-05-14 at 6.53.00 PM.png
Screen Shot 2019-05-14 at 6.53.03 PM.png
Market News April 27, 2019

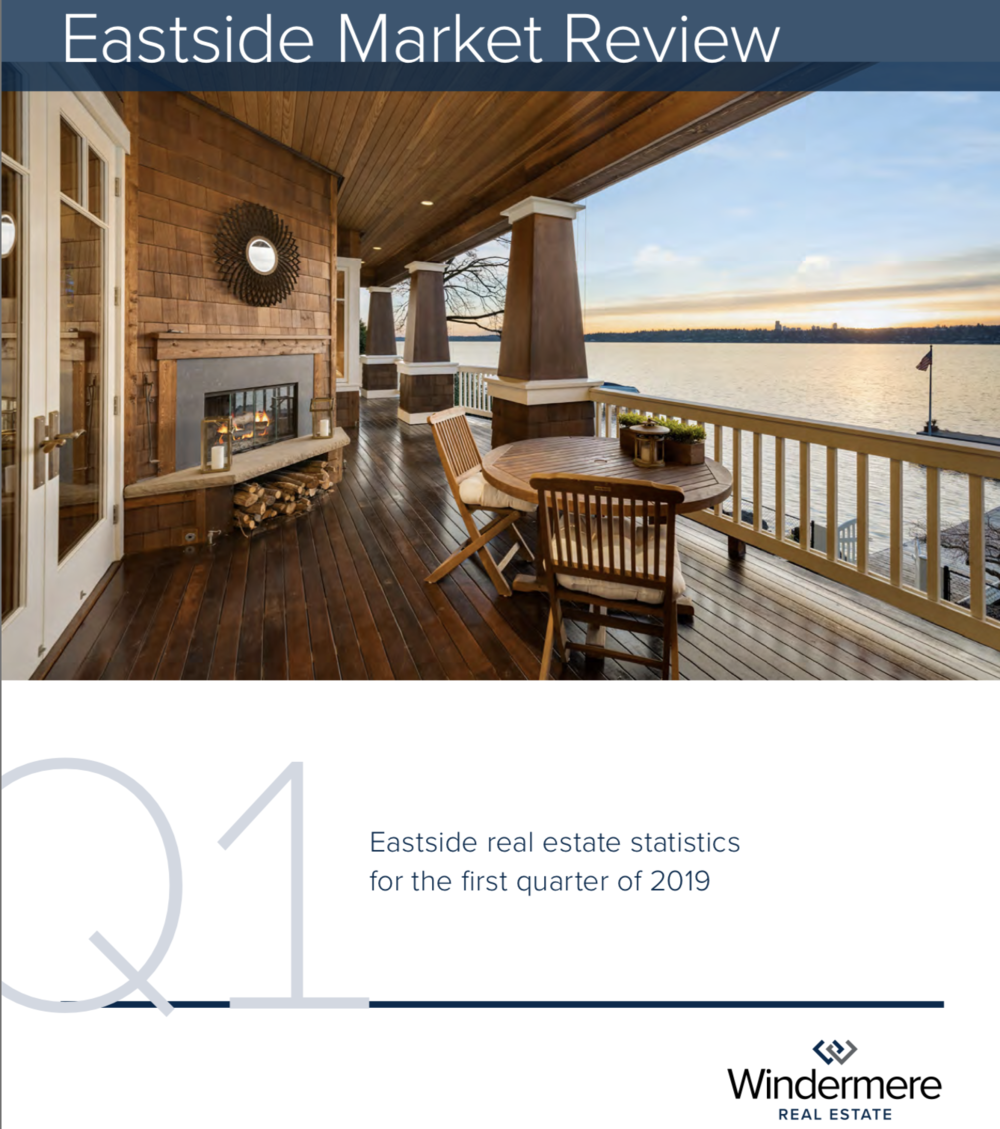
Eastside Market Review – First Quarter 2019

Screen Shot 2019-04-23 at 8.44.59 PM.png

First Quarter – 2019

The spring home buying season started early this year. Open houses had increased attendance and bidding wars returned in March. Home prices in most of the region are about even with March of 2018. The Eastside median closed sales price decreased 1% from March 2018 ($831,000) to March 2019 ($825,000). Months supply of inventory decreased from 1.8 in February 2019 to 1.2 in March 2019, its lowest in nine months. The number of Eastside sales increased 2% for the first quarter 2019 compared to 2018. The speed of the market (percentage of homes sold in two weeks or less, number of multiple offers) is slower than a year ago (arguably a good thing), although it is speeding up.

Click here to view or to download the report.